

the research library
Research
Over a decade across music technology, computer vision, IoT and industry.
Open a leaf to read it.
No leaf in this manuscript matches your search.
Datasets and papers live on the Publications page; videos on Demos.
This project is part of my PhD research at the University of Trento, in collaboration with Prof. Marcelo M. Wanderley (McGill University) and Prof. Luca Turchet (University of Trento). It integrates real-time gesture detection with a pre-existing musical pattern detection framework to create a Smart Musical Instrument (SMI) capable of triggering peripheral devices — lighting, effects, metaverse elements — through the combined use of physical and musical expression.
The paper, Melody and Motion: Integrating Guitar Gestures with Musical Patterns for Extended Control in Live Performance and Metaverse Applications, was presented at the International Symposium for the Internet of Sounds 2025.
Motivation — The Functional-to-Theatrical Continuum
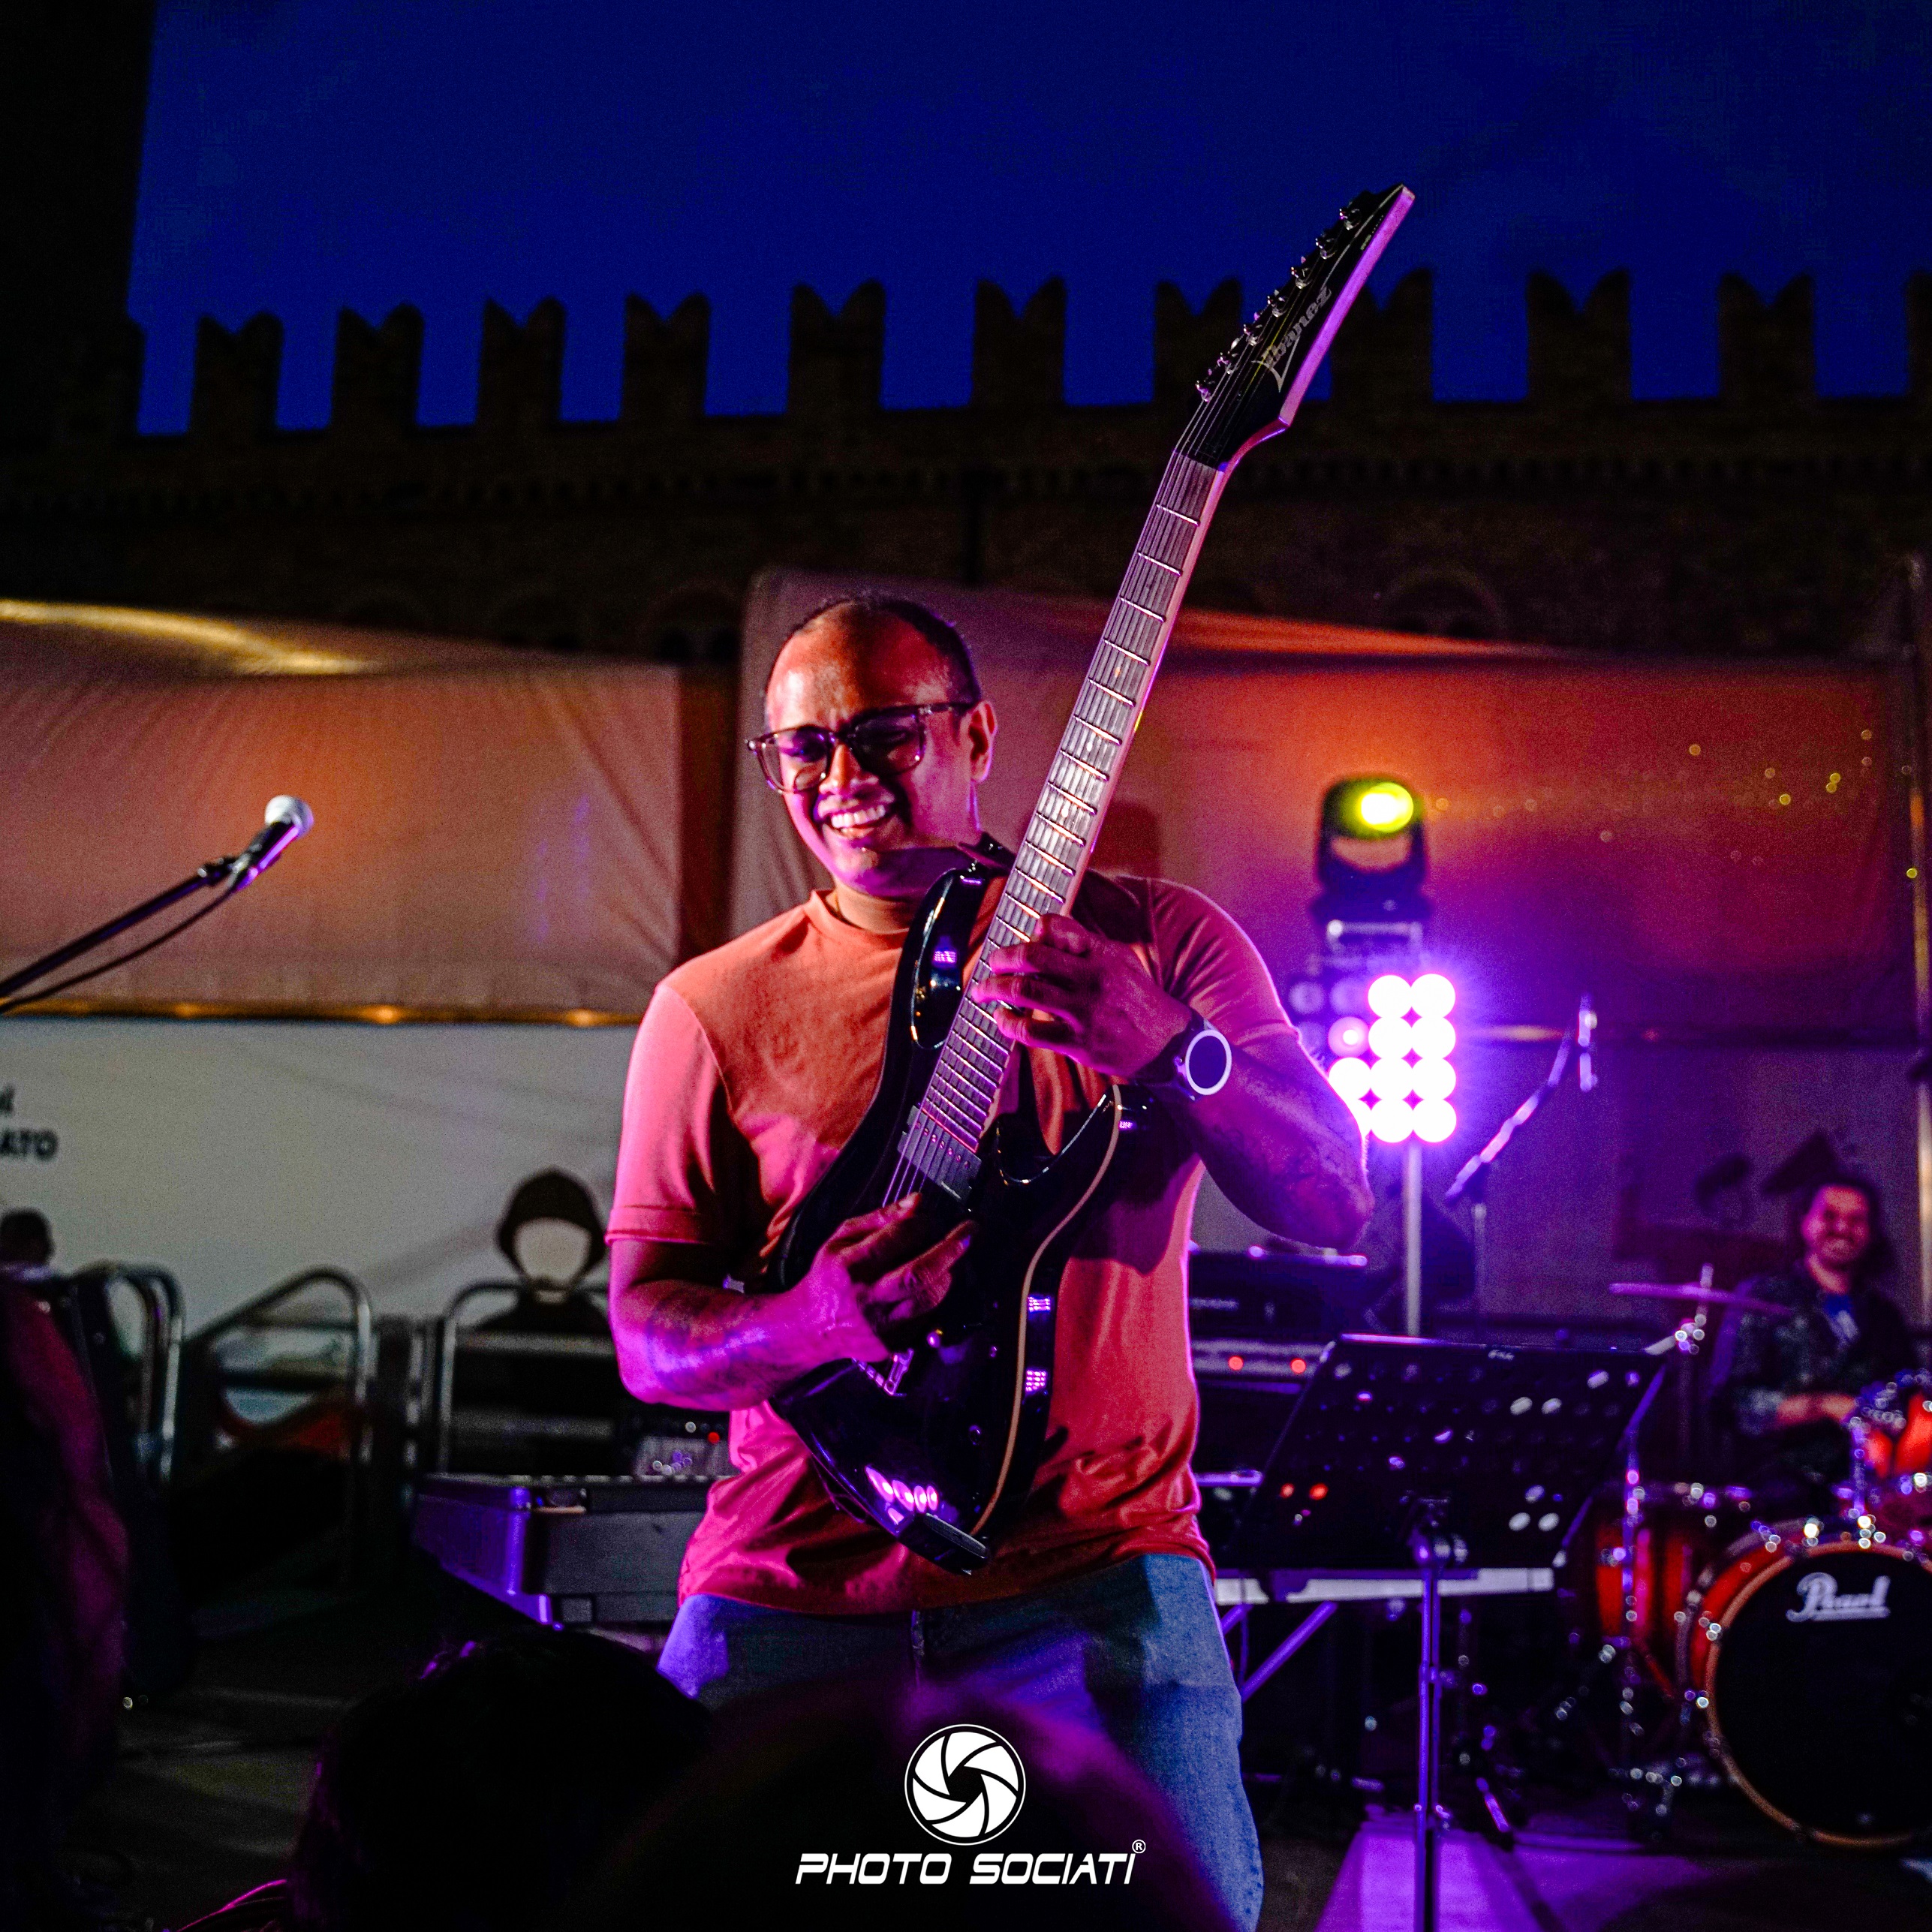
Guitarists have always used their bodies expressively on stage — Jimi Hendrix playing behind his back, Chuck Berry's duckwalk, Jimmy Page raising his guitar for high notes. But beyond theatrics, movement and music are deeply intertwined: gestures often cue or follow key musical phrases, and the boundary between a functional technique adjustment and a deliberate theatrical flourish is surprisingly fluid.
To understand this continuum, I conducted a case study with 5 professional guitarists (mean age 32.2, all experienced in live performance with bands). Through structured interviews, I probed both their unconscious functional movements — tilting the neck for fret access, bracing during fast passages — and their deliberate theatrical ones. The findings confirmed that movements exist on a spectrum: a neck tilt done for technique gradually becomes a crowd-facing raise at the peak of a solo. Musical dynamics, technical difficulty, and audience energy all jointly influence when a gesture tips from functional to theatrical.
A key insight was that guitarists consistently reported making signature movements immediately after iconic musical phrases. This motivated the core design of the system: a combined musical pattern + gesture trigger, rather than gesture alone.

System Architecture
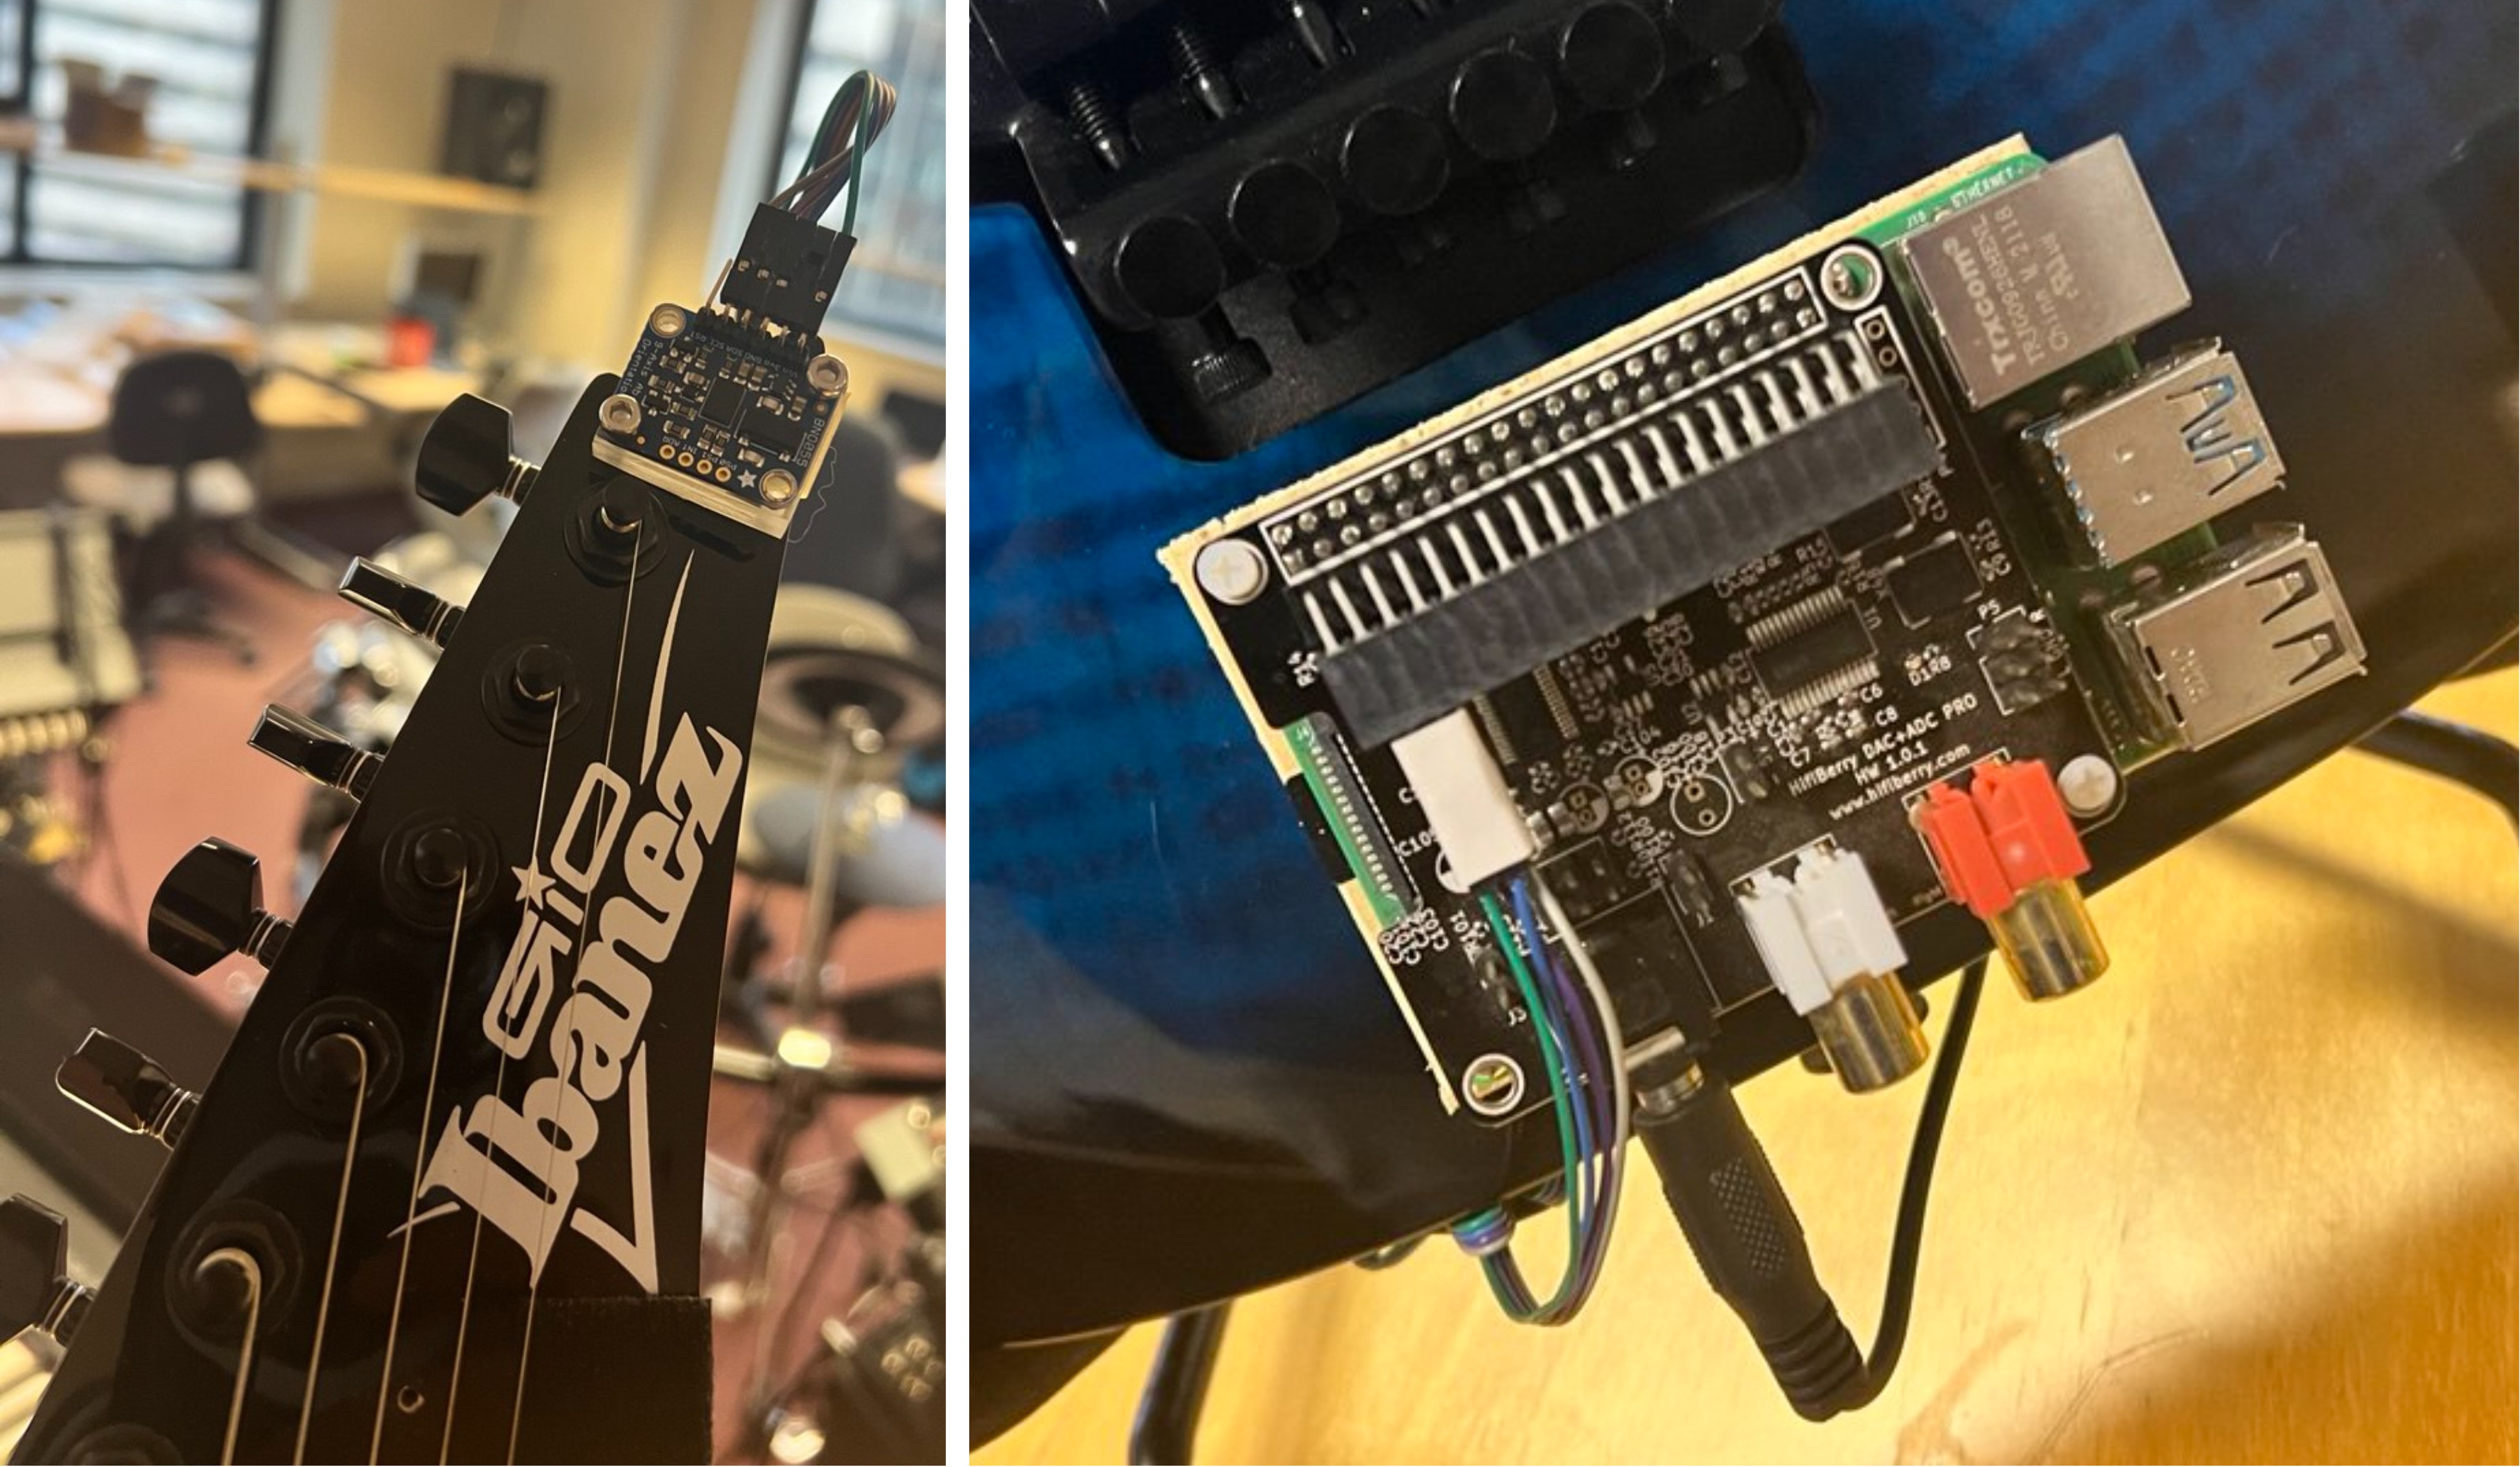
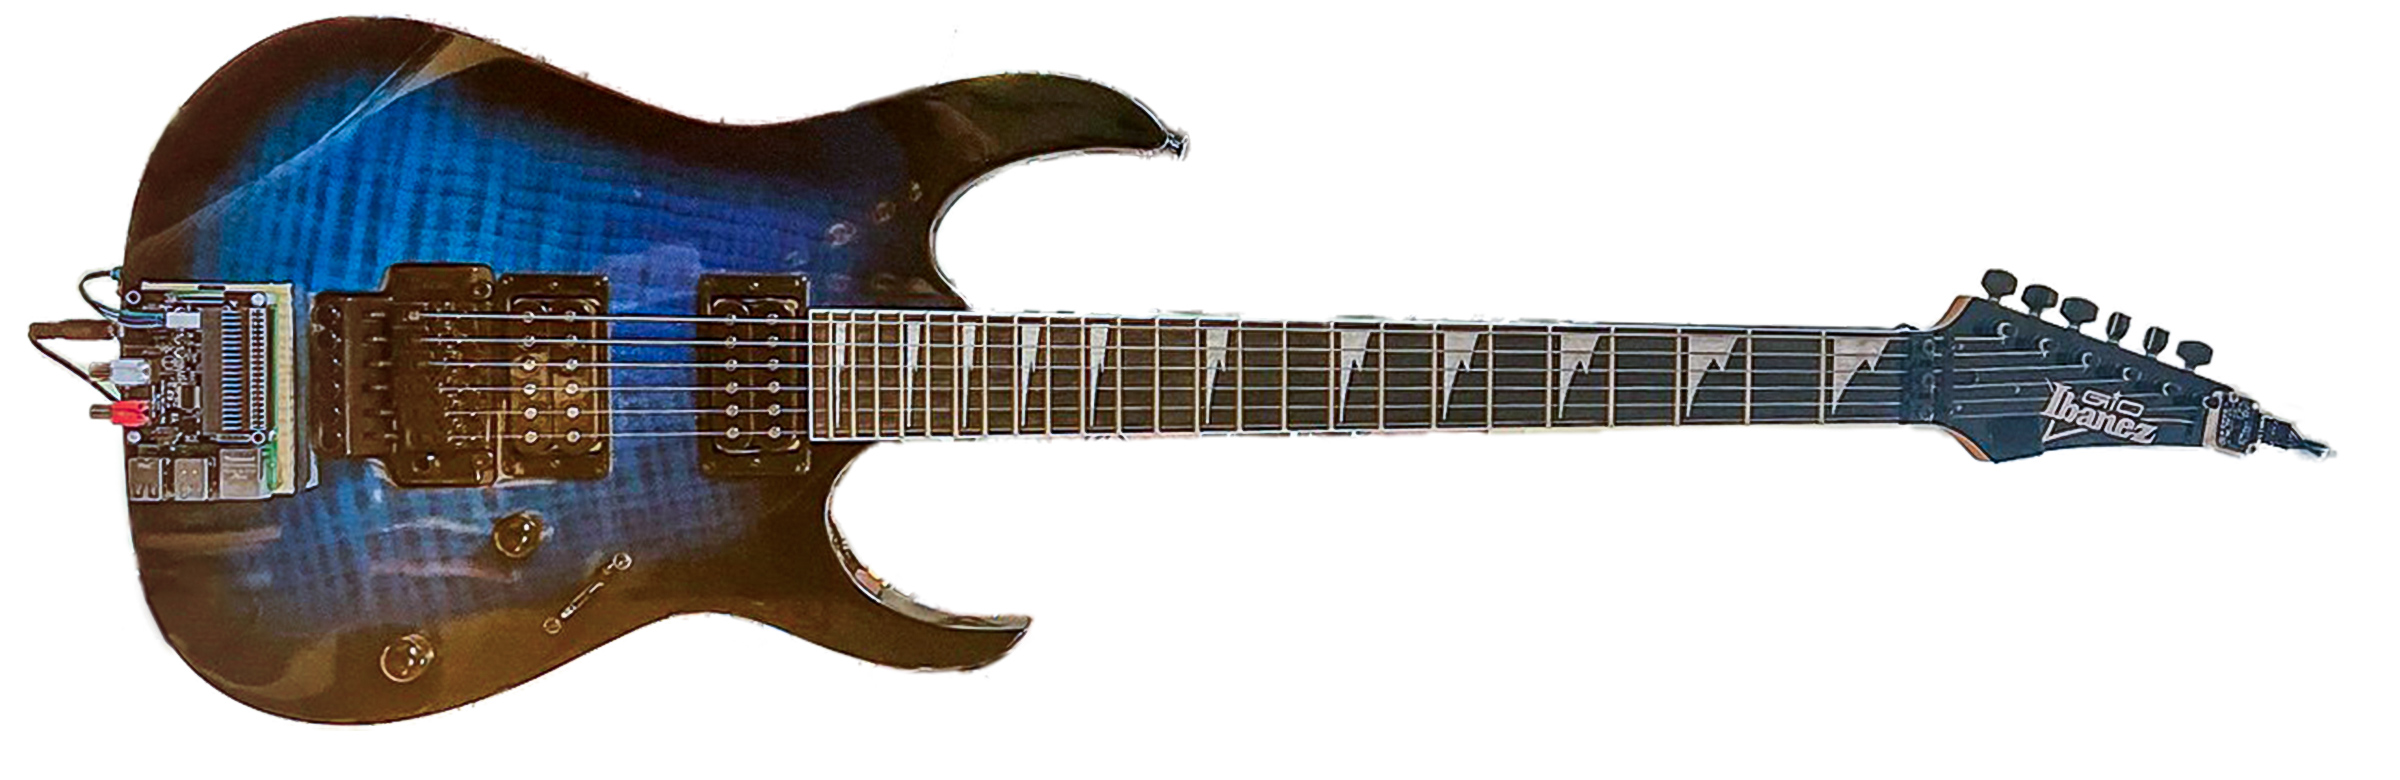
The SMI is built around a Raspberry Pi 4 with a HiFiBerry DAC+ADC audio interface, all self-powered and mounted directly on the guitar body. Audio output is split — one path to the detection system, one to the PA. A BNO055 IMU sensor is attached to the headstock (the point of maximum movement on a guitar) and connected via I²C to the Raspberry Pi, sampling at 100 Hz. Wireless OSC messages are transmitted upon detection to control any networked peripheral device.
Two independent detection algorithms run in parallel on the embedded system:
- Musical Pattern Detection (RTPD): Audio is sampled in 30 ms windows. MFCCs are extracted (FFT size 2048, hop size 512, 10 Mel bins) and fed to a stacked RNN — comprising LSTM (256 units), GRU (128 units), and Simple RNN (256 units) layers. The model is trained on synthetically generated variations of each target pattern (up to ~10,000 variations per pattern) to be robust to expressive deviations like added notes, removed notes, and timing shifts.
- Gesture Detection: Accelerometer data from the BNO055 is hard-clipped to remove artifacts, then buffered in a 1-second sliding FIFO window (100 samples). X, Y, and Z acceleration vectors are concatenated and fed to a single-LSTM RNN (256 units). Two gestures were selected based on the case study: neck raise (G1) — tilting the fretboard upwards — and forward tilt (G2) — rotating the neck horizontally towards the audience.
Combining Pattern and Gesture — The State Machine
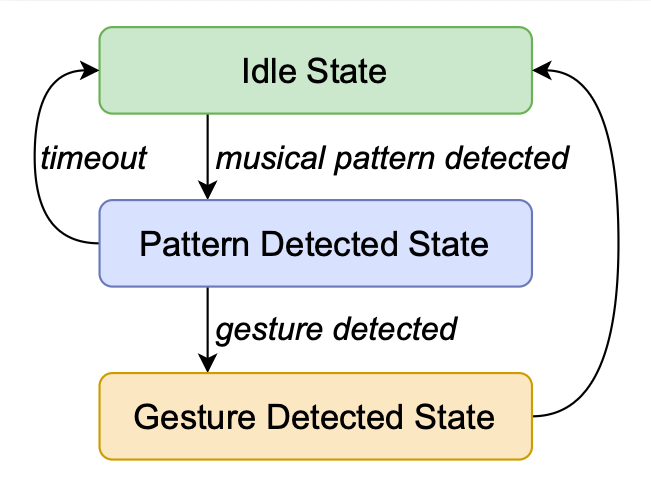
The outputs of both systems are combined by a Hierarchical Finite State Machine (HFSM) with three states: Idle → Pattern Detected → Gesture Detected. A trigger fires only when the correct musical pattern is immediately followed by the corresponding gesture — meaning stray motions during silence and mis-played patterns are both gracefully ignored. This design reflects how guitarists actually perform: the music cues the gesture, not the other way around.
Technical Evaluation
The system was evaluated using a 500-event test corpus covering five conditions: correct pattern→gesture sequences (P1→G1, P2→G2), cross-mapped sequences (wrong gesture for the pattern), pattern-only events, and gesture-only events. Results across the full corpus:
- Precision: 0.79
- Recall: 0.76
- F1 Score: 0.78
Qualitatively, the evaluator noted the forgiving nature of the HFSM — mis-played patterns never triggered gestures, and isolated motions during rests were consistently ignored. This highlights a key advantage of requiring both cues simultaneously.
Metaverse Applications
The case study participants were also shown recordings of Metaverse concerts and asked how their movements would translate into virtual environments. All five expressed enthusiasm for avatar-mirroring of large gestures, and suggested novel virtual-only effects: environment changes, particle trails, avatar size scaling, and transporting the audience to a different virtual location. The system's OSC output is designed to feed directly into these virtual worlds, making the guitarist's body a programmable controller for the Metaverse stage.
This work is supported by the MUSMET project, funded by the EIC Pathfinder Open scheme of the European Commission (grant agreement n. 101184379).
This is the paper that started the series. Written while I was an independent researcher based in Colombo, Sri Lanka, in collaboration with Prof. Carlo Fischione (KTH Royal Institute of Technology) and Prof. Luca Turchet (University of Trento), it was published at the 27th FRUCT Association Conference.
The central question was simple but unexplored: can a musical instrument detect the patterns it is playing, in real time, as they happen — with no recording, no offline processing, and no knowledge of what comes next? This matters enormously for IoMusT applications, where a smart instrument needs to identify a phrase as soon as it is played and instantly fire a control message to connected devices.
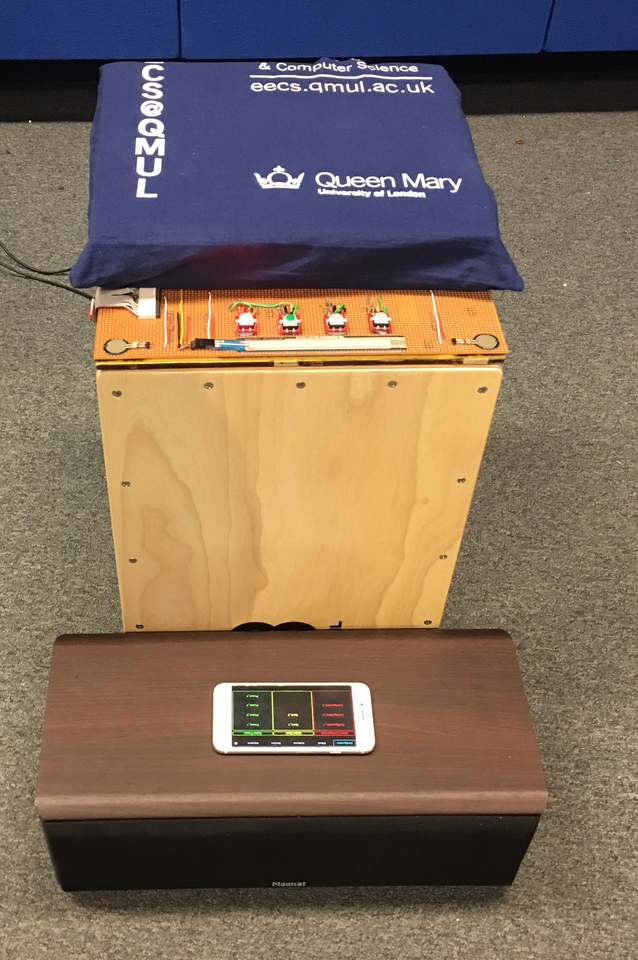
Note Representation
We introduced a compact MIDI-based matrix representation encoding three core attributes per note: pitch (MIDI number), amplitude (MIDI velocity), and duration (seconds). A musical pattern is then a sequence of such column matrices, and detection becomes a sequence matching problem on a live stream.
Methods Compared
We evaluated five candidate approaches on a synthetically generated dataset:
- Deterministic system: Strict boundary-check on all three note attributes with user-defined tolerances. Achieved 100% detection with zero false positives on the synthetic dataset — but inherently brittle: any deviation outside tolerance is a miss
- Single neural network: One network trained on all patterns simultaneously; input padded to a fixed length. Higher false positive rate but flexible
- Multiple neural networks: A dedicated binary-output network per pattern, each trained on its own variations
- CNN: Convolutional architecture applied to the matrix representation
- RNN: Recurrent architecture; showed the highest true positive rate among ML methods, though with significant false positives on this early synthetic dataset
The deterministic system and RNN emerged as the strongest candidates, motivating the more targeted follow-up work that replaced the boundary-check approach with similarity-based methods. One early prototype built from this research was selected as a finalist for the MIDI Awards 2023 — judged by Roger Lynn, Pedro Eustache, and Nina Richards. The event livestream is available HERE.
Published at the 25th International Conference on Digital Audio Effects (DAFx 2022) in Vienna, this paper introduced a novel non-ML approach to real-time monophonic symbolic pattern detection — one that borrowed a core technique from Computer Vision.
The motivation was to fix two key weaknesses of the earlier deterministic system: too many false detections when note attributes strayed just outside tolerance, and complete inability to handle transposed patterns. The new approach also eliminates the training overhead of ML methods, making it far faster to deploy for a musician who wants to define a new pattern.
Four-Attribute Note Representation
We extended the earlier 3-attribute representation to include a fourth: pitch bend. Guitar players and keyboard players routinely use pitch bend for expressive effect — a glissando, a string bend, vibrato — and capturing these graceful pitch changes is essential for robust detection. Rather than storing all 158+ MIDI pitch-wheel messages per bend, we extract only the local minima and maxima, preserving the shape of the bend with minimal data.
The SSIM Approach
The Structural Similarity Index Measure (SSIM) is a Computer Vision metric that compares two images by measuring luminance, contrast, and structure. We repurposed it here to compare two musical note sequences: each attribute vector (pitch, pitch-bend, amplitude, duration) is treated independently, and an SSIM value is computed for each pair. The four values are combined into a single Match Measure (MM) via weighted summation:
MM = SSIM(pitch) + 0.2 × SSIM(amplitude) + 0.2 × SSIM(pitch-bend) + 0.3 × SSIM(duration)
A perfect match yields MM = 1.7; any attribute deviation lowers the score. Because each attribute contributes independently, the system gracefully handles partial deviations — exactly as a human listener would.
Bicubic Interpolation for Variable-Length Patterns
A musician may add extra notes or double notes within a phrase without changing its perceptual identity. To handle this, we use bicubic interpolation — borrowed again from image processing — to resize the incoming note sequence to match the length of the stored pattern before computing SSIM. This is what allows the method to compare patterns of different lengths without requiring an exact note-for-note alignment.
Results
The algorithm was evaluated on three datasets: a human-recorded dataset, a synthetically generated dataset, and the standard JKUPDD musicological dataset (Beethoven, etc.). An overall detection rate of 95% was achieved. Critically, the low computational load and near-instant inference demonstrate its suitability for direct deployment on embedded systems — no GPU, no training pipeline, no pre-processing window required.
Published at Audio Mostly 2024 in Milan, this paper pushed the symbolic monophonic detection work in two directions simultaneously: replacing ad-hoc synthetic datasets with a large-scale human-recorded benchmark, and conducting a rigorous head-to-head between Dynamic Time Warping and Recurrent Neural Networks as the number of patterns scales up.
The DoMP Dataset
A central contribution is the Dataset of Musical Patterns (DoMP), publicly available at zenodo. The dataset contains 4,000 patterns and expressive variations recorded by 40 musicians — 20 keyboard players and 20 electric guitar players from diverse backgrounds (classically trained pianists, church organists, session musicians, rock and blues guitarists, jazz players). Each musician composed 10 distinct monophonic patterns and then repeated each 9 more times, freely adding expressive variations — string bends, hammer-ons, passing chromatic notes, velocity shifts, doubled notes — as long as the phrase remained perceptually identical to an untrained listener. The dataset exists in both MIDI and audio format and is designed as a worst-case benchmark: the most challenging expressive variations a pattern detection system is likely to encounter in real performance.
Synthetic Variation Generator
Training an RNN requires many examples. Rather than asking musicians to record hundreds of repetitions, we developed a rule-based model that generates synthetic melodic and expressive variations of any given ground-truth pattern. The rules were derived from careful analysis of the DoMP recordings — identifying the most common variation types and encoding them as parameterised transformations. This allows a musician to define a new pattern with a single recording and immediately have a trained model ready.
DTW vs RNN: How They Scale
Both methods perform well when detecting up to 3 distinct patterns. But as the number of patterns increases to 10:
- Dynamic Time Warping: Shows a significant negative correlation between the number of patterns and recognition accuracy — the more patterns, the more false positives
- RNN: Maintains approximately 98% detection accuracy across all pattern counts — the classifier simply adds an output class for each new pattern without degradation
The conclusion is clear: for real-world use cases where a musician has a library of 5–10 licks they want to map to controls, DTW is not a viable approach. The RNN architecture is the correct choice, and this paper provides the dataset and evaluation methodology to prove it.
Published in the Journal of the Audio Engineering Society (JAES), Vol. 74, No. 3, March 2026, this paper represents the culmination of the pattern detection research thread — moving beyond symbolic MIDI to raw polyphonic audio, and beyond benchmarks to actual embedded deployment on a Raspberry Pi 4.
Every previous method required the instrument to output MIDI — either natively (keyboards) or via a MIDI tracker (guitars). This is a significant constraint: audio-to-MIDI conversion in real time is still an unsolved problem, and requires expensive or unreliable hardware. Moving to direct audio input removes this dependency entirely, making the system practical for any guitar, keyboard, or acoustic instrument.
The DoPP Dataset
A new Dataset of Polyphonic Patterns (DoPP) was created, available at zenodo. Unlike the earlier monophonic DoMP, musicians here were free to use any combination of monophony and polyphony — chords, double stops, chord melodies — making the detection problem substantially harder. 20 musicians (10 keyboard, 10 guitar, mean age 38.5) each contributed 10 patterns with 9 expressive repetitions. Mean pattern duration: 7.4 seconds. The dataset captures diverse timbral signatures across multiple instruments and pickup selections.
Architecture
Audio is processed in 30 ms windows with a 10 ms hop. Mel-frequency cepstral coefficients (MFCCs) are extracted and fed into a stacked recurrent neural network. A synthetic training dataset is generated from the real recordings using the same rule-based variation model developed for the DoMP work. For the DTW baseline, multidimensional DTW is computed across all Mel bands, with a threshold determined via Youden's index on a validation split.
Results on Embedded Hardware
| RNN | DTW | |
|---|---|---|
| Precision | 0.74 | 0.80 |
| Recall | 0.775 | 0.555 |
| F1 Score | 0.76 | 0.65 |
| Inference Time (RPi 4) | 14 ms | 1038 ms |
| CPU Usage (RPi 4) | 31.4% | 48.9% |
The DTW method achieves slightly higher precision but cannot operate in real time — 1038 ms inference on a Raspberry Pi 4 is over 70× the 14 ms window needed for latency-transparent musical triggering. The RNN method meets real-time requirements comfortably, runs within the CPU budget of an embedded system, and achieves a substantially better F1 score by retaining far higher recall. A video of the system in operation is available at HERE.
What if the music you play could physically move the audience — not just emotionally, but through light, vibration, and virtual objects materializing in front of their eyes? This project explores exactly that, through the lens of the Internet of Musical Things (IoMusT): a network of smart instruments, stage equipment, and audience devices all responding to music in real time.
The paper, Interactive IoMusT-Based Concerts: Real-Time Pattern Recognition and Audience Experience, was co-authored with Alberto Boem and Prof. Luca Turchet at the University of Trento, and published at the IEEE I3DA 2025 conference.
The Concept
The system allows performers playing Smart Musical Instruments (SMIs) to wirelessly trigger a range of sensory effects the moment they play a pre-defined musical pattern — without any manual controllers or interruption to their playing. The music itself is the controller. When a guitarist plays a specific lick, the stage lights sweep blue. When the drummer plays their pattern, smartphones in the hands of every audience member vibrate, and smoke fills the stage. When the keyboardist plays theirs, coloured 3D spheres appear in the air in front of the audience through Mixed Reality headsets.
The Performance Ecosystem
Two live concerts were staged in an ecologically valid venue designed to resemble a music club. Each featured a trio of performers — guitarist, keyboardist, and drummer — each playing an SMI with an embedded Raspberry Pi 4 and a trained RNN model for real-time pattern detection. Upon detecting a pattern, the instrument transmitted a wireless OSC message over a local Wi-Fi network to a central server, which routed the command to the appropriate devices.
The audience devices and stage equipment were:
- Stage lights: Two Varytec Hero Wash 715 HEX LED moving heads + a Stairville Stage TRI LED bar — capable of dynamic color, rotation, and beam control
- Smoke machine: AF-180 LED Fogger for dramatic moments
- Mixed Reality headsets: 10 Meta Quest 3 devices per performance, each displaying interactive 3D objects spawning in passthrough view, built with Unity and the Meta XR SDK
- Haptic smartphones: Each audience member held an Android phone running a web app (Node.js + Vibration API) that delivered patterned vibrotactile pulses when the drum pattern was detected
Routing between instruments and devices was configured through the Hot Licks Mapper — a dedicated visual composition tool developed alongside this system. For these concerts: guitar pattern → blue lights + MR spheres; keyboard pattern → green lights + MR spheres; drum pattern → red lights + smartphone vibrations + smoke. See the Hot Licks Mapper card for a full description.
Results
Each piece was performed twice — once with RTPD-triggered effects (Coherent condition), and once with randomly timed effects — allowing a direct within-session comparison. Key findings across 20 audience members and 6 performers:
- Lights and vibrations were rated significantly more coherent with the music in the RTPD-driven condition (both p \< .05)
- Stage lighting was the most engaging and least distracting modality across both conditions
- MR headsets showed mixed responses — participants with prior VR experience perceived higher coherence; those unfamiliar with headsets reported distraction and some discomfort
- Performer satisfaction was high across the board: satisfaction 9.33/10, enjoyment 8.33/10, willingness to use AI tools in performances 8.16/10
- An unexpected theme emerged from audience feedback: social interaction. Seeing other audience members physically reaching for and playing with virtual objects — through the headset's passthrough — became its own layer of enjoyment
An unanticipated but telling quote from the audience: "Watching others interacting with things that are not there is very funny... seeing everyone with a headset and playing with nonexistent things, while I am playing with the balls in my headset was very cool."
Performers expressed particular interest in using the RTPD system as a teaching tool — using pattern detection accuracy to trigger a green or red light as real-time feedback for students practising specific phrases or techniques.
A video of the full ecosystem and concert is available HERE. This work is supported by the MUSMET project, funded by the EIC Pathfinder Open scheme of the European Commission (grant agreement n. 101184379).
The Hot Licks Mapper is a web-based visual composition and routing application developed as part of the IoMusT-Based Concerts project. It sits at the heart of the performance ecosystem — the single tool through which a composer wires together what happens on stage and in the audience whenever a musician plays a defined musical phrase.
The core design metaphor is a patchbay. Smart Musical Instruments (SMIs) with embedded pattern detection appear as input blocks, and output devices — stage lights, smoke machines, MR headsets, haptic smartphones, projectors — appear as output blocks. The composer draws arrows from patterns to stimuli to define the routing. Lines can be added, rerouted, or removed live during a performance from a handheld tablet on the same Wi-Fi network, enabling the show to evolve in real time without stopping or interrupting the musicians.
Mapping Modes
The application supports four types of mappings, giving composers fine-grained control over how musical events propagate through the performance space:
- One-to-one: A single pattern on one SMI triggers one stimulus on one device — the simplest mapping, useful for tight synchronization (e.g., guitar pattern fires the moving head lights blue)
- One-to-many: A single pattern triggers stimuli across multiple device types simultaneously (e.g., drum pattern fires the smoke machine, smartphone vibrations, and red lights all at once)
- Many-to-one: Multiple patterns from different SMIs must all fire to trigger a single combined effect — enabling compound cues that require the whole band to align
- Many-to-many: Multiple patterns mapped to multiple stimuli — the most expressive mode, allowing a single musical moment to cascade across the entire sensory environment
Technical Architecture
Each SMI transmits an OSC message over Wi-Fi upon pattern detection. The Hot Licks Mapper runs as a web application on a central server, receiving these OSC messages and routing them according to the active mapping configuration. Output devices are addressed by IP and subnet — MR headsets on one subnet, smartphones on another, QLC+ (controlling stage lights and smoke) on a third. The composer's tablet communicates with the server over the same local network, dynamically modifying the routing graph in real time without any code changes.
Design Motivation
The need for this tool emerged from the constraints of live performance. Musicians cannot reliably trigger effects manually without introducing latency or requiring a dedicated technician watching every instrument simultaneously. By making the instrument itself the trigger and the Mapper the routing brain, the system is hands-free for performers and composer-programmable without any embedded code changes.
Audience evaluation confirmed the value of precise timing: light and vibration effects triggered by the pattern detection system were rated significantly more coherent with the music than randomly-timed equivalents (both p \< .05). The Mapper's routing precision is a direct contributor to that perceptual coherence.
This work is part of the MUSMET project, funded by the EIC Pathfinder Open scheme of the European Commission (grant agreement n. 101184379). A video of the system in action during the live concerts is available HERE.
One of the persistent obstacles in real-time pattern detection research is data. Most publicly available datasets are either fully synthetic, recorded in studio conditions, or designed for offline pattern discovery — not for the live, expressive, human performance scenario a smart musical instrument must handle. To bridge this gap, I created three complementary datasets across the course of my PhD, each extending the complexity of the previous one: from symbolic monophony, to rhythmic percussion, to polyphonic audio.
DoMP — Dataset of Musical Patterns
The DoMP is a dataset of monophonic musical patterns and expressive variations, available at zenodo (DOI: 10.5281/zenodo.10818617). It contains 4,000 patterns and variations — 400 distinct ground-truth patterns and 3,600 expressive repetitions — contributed by 40 musicians (20 keyboard players, 20 electric guitar players) from diverse ethnic and musical backgrounds (Italian, British, Scottish, Filipino, Spanish, Ugandan, and Sri Lankan; aged 18–43, mean 28.5). Musicians ranged from classically trained pianists and church organists to studio session players, jazz musicians, blues guitarists, and rock band members.
Each musician composed 10 distinct monophonic phrases and then repeated each 9 more times with full artistic freedom, subject to one condition: each repetition must remain perceptually equivalent to the original, by their own judgment. Guitar recordings were captured using a Fishman TriplePlay MIDI tracker on Ibanez S470 and Epiphone SG Standard guitars. Both MIDI files are included. Analysis of DoMP revealed an average pattern length of 20.45 MIDI notes, mean amplitude variation of 9.24 MIDI velocity units, and a 26.5% probability that a given pattern contains pitch bends. The dataset is deliberately designed as a worst-case benchmark.
DoDP — Dataset of Drum Patterns
The DoDP extends the DoMP framework into the rhythmic and percussive domain. Building on the same methodology, 10 drummers (all Italian, aged 18–36, mean 26.0) from diverse backgrounds — professional session drummers, jazz drummers, rock and metal band members, orchestral percussionists, and ethnic/traditional percussion players — each contributed 10 distinct drum patterns with 9 expressive repetitions each, yielding 1,000 total recordings (100 distinct patterns and 900 variations).
All recordings were made using a Yamaha DTX-432k electronic drum kit configured with the standard General MIDI percussion mapping, enabling consistent MIDI note-number assignments across all recordings. Each MIDI file contains note numbers, velocity data, precise tick timing, and hi-hat pedal controller data. Key statistical characteristics include an average pattern length of 16.8 MIDI events, mean velocity variation of 12.6 units, and a 44 time signature in 75% of patterns. Compared to DoMP, DoDP shows smaller average temporal deviations (42.3 vs. 77.6 MIDI ticks) and more consistent pattern lengths — reflecting the greater rhythmic precision typical of drummers versus melodic players.
DoPP — Dataset of Polyphonic Patterns
The DoPP completes the three-dataset framework by moving into polyphonic audio, available at zenodo (DOI: 10.5281/zenodo.14497998). It was created with 20 musicians (10 keyboard, 10 guitar; Italian and Sri Lankan; aged 26–55, mean 38.6), each contributing 10 polyphonic patterns with 9 expressive repetitions, yielding 2,000 total audio recordings. Unlike DoMP, musicians were free to use any combination of monophony and polyphony — chords, double stops, chord melodies, contrapuntal motion — making the detection problem substantially harder.
Recordings were made at 44.1 kHz, 24-bit resolution using Universal Audio RME Fireface UFX and Zoom U-24 audio interfaces. Electric guitars were recorded as direct unprocessed input; keyboard players were asked to refrain from time-based effects. The dataset captures a wide range of instruments (Ibanez S470, Ibanez RGA7, Fender Stratocaster, Gibson Les Paul, Fender Telecaster, Korg Krome, Roli Seaboard, Korg KRONOS, and others) and diverse guitar-specific techniques including fingerstyle playing, hybrid picking, polyphonic string bending, and multi-finger tapping. Average pattern duration is 8.4 seconds (SD 5.54), with a dynamic range of −24 dB to 0 dB.
A Three-Tiered Framework
Together, DoMP → DoDP → DoPP form a deliberate progression from the simplest symbolic single-voice case to the most complex real-world polyphonic audio scenario. All three datasets share an identical file naming convention (artistID_patternID_versionID) and folder structure for straightforward integration into evaluation pipelines. The systematic recording methodology — live musicians, intentional expressive variations, perceptual equivalence as the only constraint — makes all three datasets uniquely suited to evaluating pattern detection systems intended for live performance, and sets a new benchmark for the field.
This paper is the publication of my Master's thesis, written at Sheffield Hallam University in collaboration with Prof. Pradeep Chathuranga Weeraddana (University of Moratuwa) and Prof. Carlo Fischione (KTH Royal Institute of Technology). It addresses one of the most foundational problems in Music Information Retrieval: beat tracking — detecting the beat locations in a piece of music the way a listener subconsciously taps their foot.
The central component of any beat tracking pipeline is the reliable detection of Beat Causing Onsets (BCOs) — the rapid, unpredictable changes in the audio signal that correspond to a beat, typically generated by a low-frequency rhythm instrument such as a kick drum or bass. Existing BCO detection methods either sacrifice performance for computational simplicity (pure spectral methods) or sacrifice simplicity for performance (statistical estimation and machine learning approaches that require training data and prior knowledge). This paper proposes a third path: a training-free, prior-free method that exploits the unique properties of the S-transform to match the performance of statistical approaches at a fraction of the computational cost.
Why the S-Transform?
Most spectral onset detection methods rely on the Short-Time Fourier Transform (STFT), which uses a fixed-size window across all frequencies. This is a fundamental limitation: the STFT must commit to a window size before processing, creating an unavoidable trade-off between time resolution and frequency resolution that applies uniformly across the entire spectrum.
The S-transform (Stockwell Transform) solves this by using a frequency-dependent window dilation — the window automatically narrows at higher frequencies and widens at lower frequencies. This is ideal for BCO detection for two reasons:
- Rhythm instruments responsible for the beat (kick drum, bass) operate at relatively lower frequencies (32–512 Hz), where S-transform naturally provides better concentration
- No window size needs to be chosen in advance — the algorithm is self-adapting across the frequency range, making it robust across musical genres and tempos
The Two-Stage Algorithm
The method operates in two stages on a short mono audio excerpt (typically 4 seconds at 44.1 kHz, downsampled by a factor of 40 to ~1.1 kHz to reduce computation):
- Stage 1 — Onset Envelopes by Band Splitting: The discrete S-transform matrix is computed for the downsampled signal. The time-frequency representation is then split into Q frequency subbands of width ~50 Hz each. For each subband, a mean onset envelope is computed by averaging across frequency rows. The result is Q independent onset envelopes — one per subband — each potentially encoding BCO information if the rhythm instrument's frequency range overlaps with that band
- Stage 2 — Onset Envelope Isolation: The key insight is that BCOs are periodic. If a subband contains BCO information, the clusters of high-amplitude components in its onset envelope will be equally spaced in time. The algorithm uses cubic spline interpolation to compute the upper envelope, centers and thresholds the signal, clusters the remaining nonzero components, and measures the consistency of spacing between consecutive cluster centers. The subband whose cluster spacings are most uniform — quantified by a regularity score bi close to 1 — is selected as the BCO-bearing envelope, and BPM is estimated from its cluster spacing
Results
The method was evaluated on two standard benchmarks used in the ISMIR 2006 competition: the Ballroom dataset (698 excerpts) and the Songs dataset (465 excerpts), covering diverse genres, tempos, and styles. Two accuracy metrics were used:
- Accuracy 1: Percentage of tempo estimates within 4% of the ground-truth tempo
- Accuracy 2: Percentage of estimates within 4% of the ground truth, or a simple musical multiple thereof (½×, 2×, 3×, ⅓×) — accounting for octave tempo errors common in beat tracking
The proposed S-transform method outperforms the pure spectral benchmark (Ellis 2007) on both datasets and both metrics, at the same asymptotic computational complexity of O(N log N) when using the fast discrete orthonormal Stockwell transform. It closely approaches the performance of the statistical estimation benchmark (Klapuri et al. 2006), which uses computationally intensive operations including filtering, comb filtering, discrete power spectral estimation, and hidden Markov model-based phase and period estimation — none of which are required by the proposed method.
The result is exactly the graceful trade-off the paper set out to find: better than simple spectral methods, comparable to complex statistical ones, and requiring no training data, no prior knowledge of the music, and no pre-set window length.
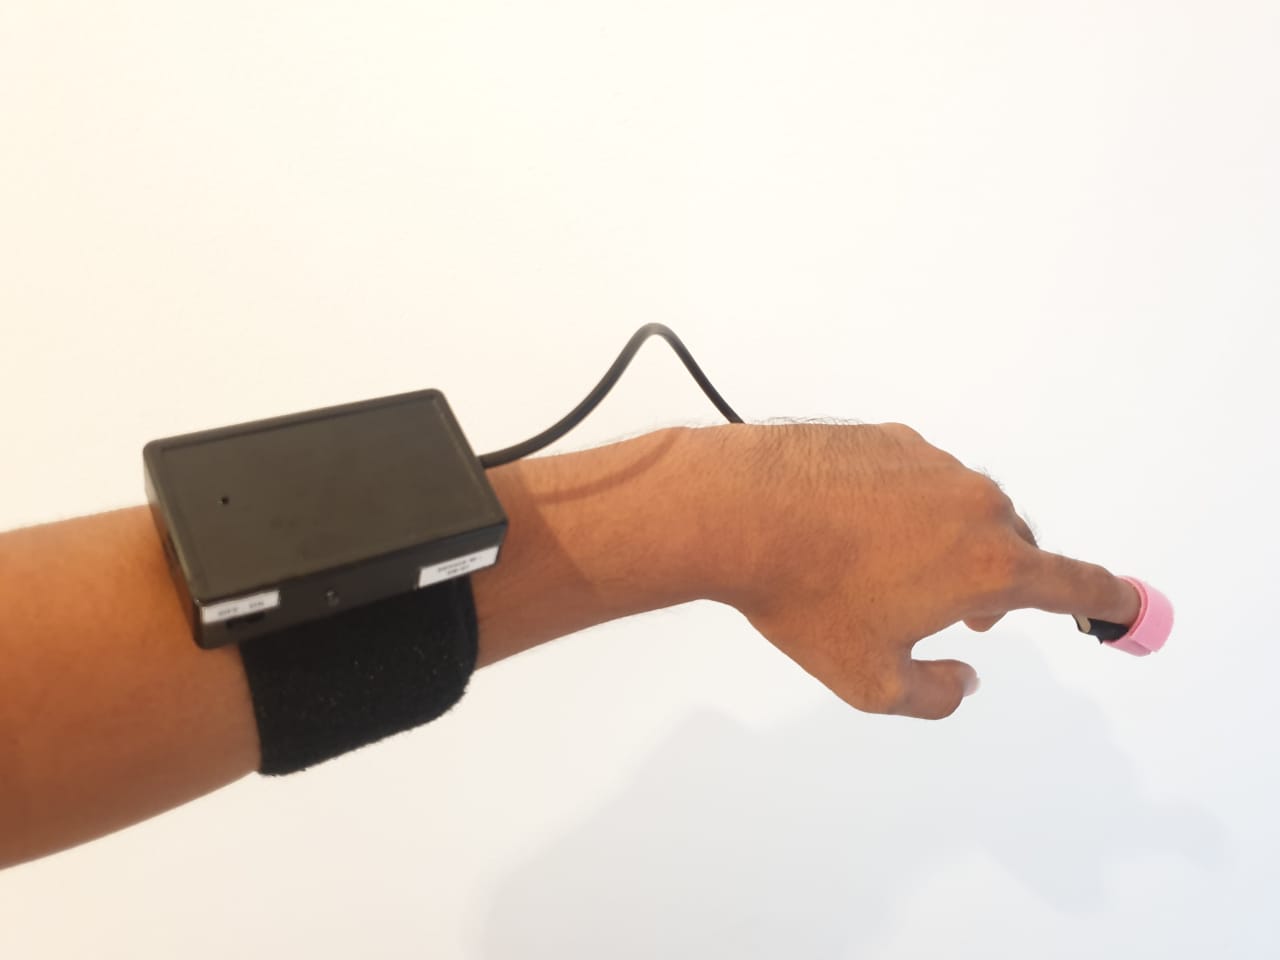
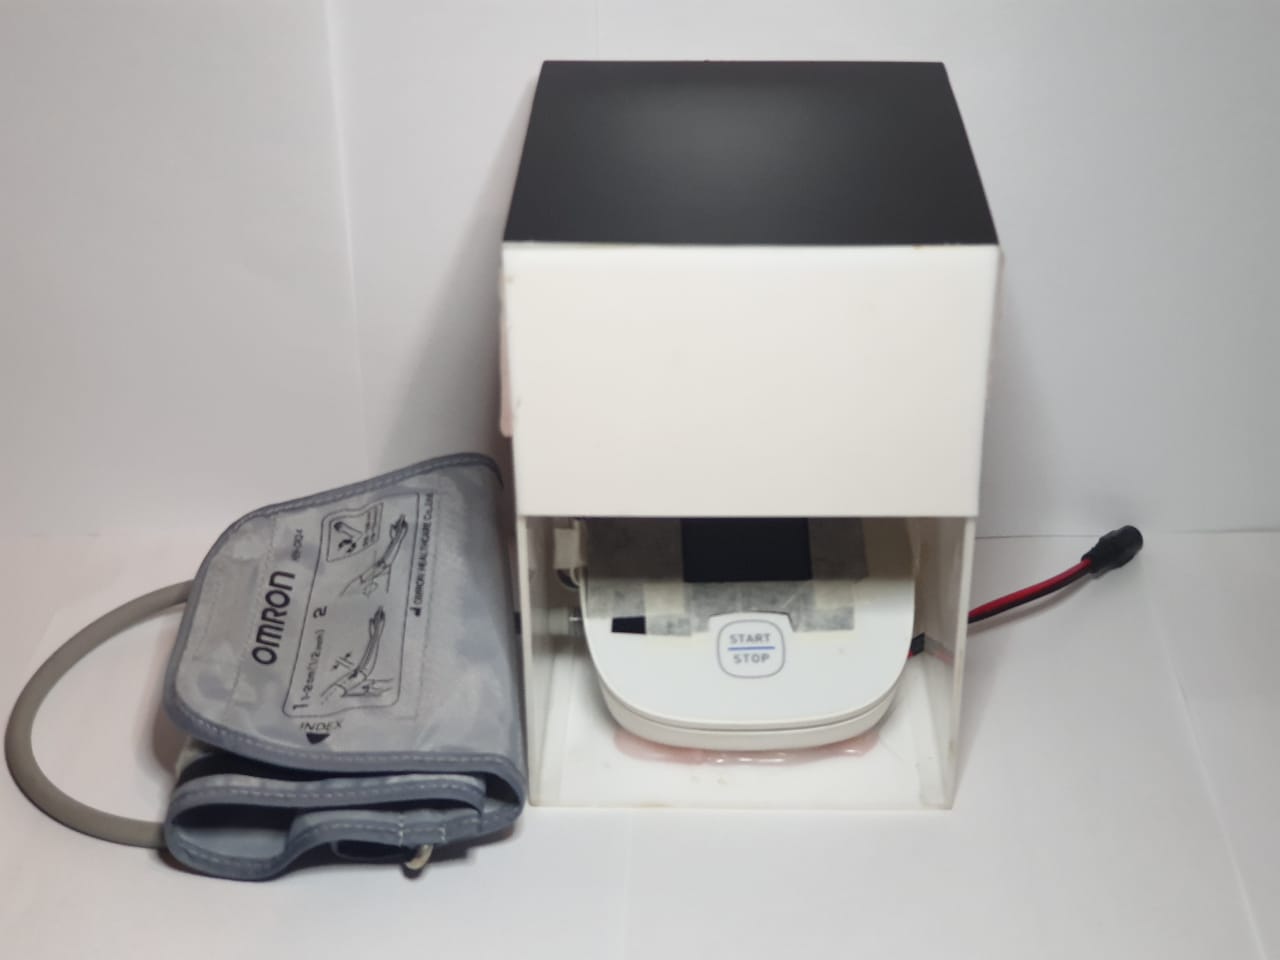
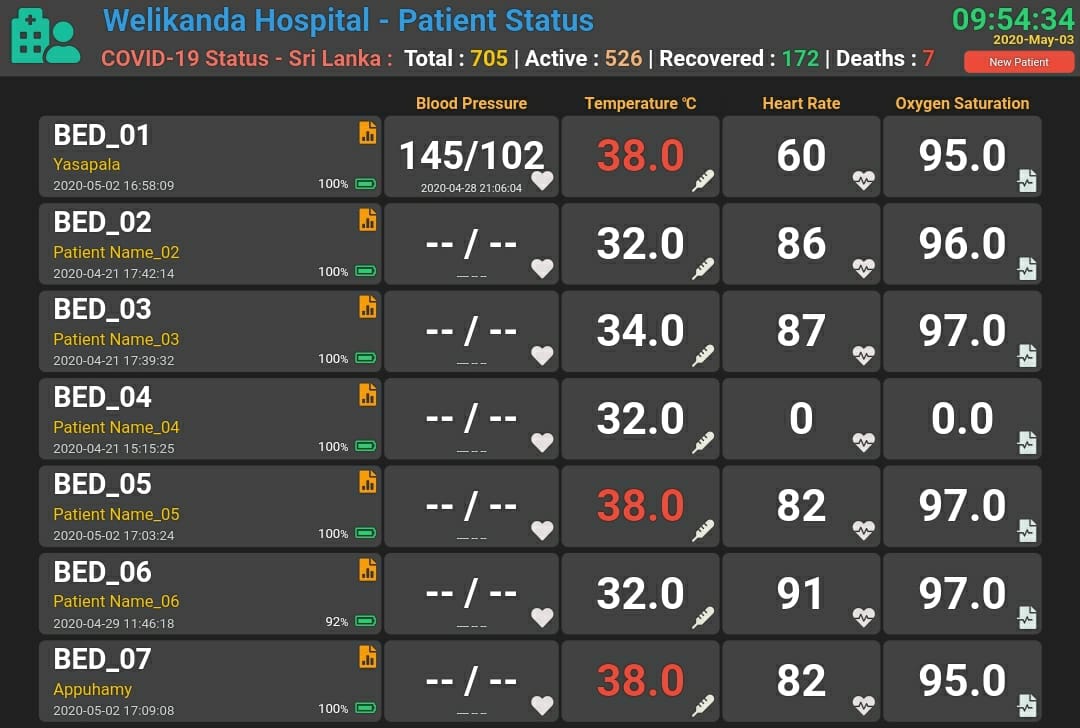
During the pandemic, I was part of a team that developed an IoT system to continuously monitor the blood pressure of COVID-19 patients remotely — reducing the risk of contamination for overworked medical staff.
Our solution revolved around retrofitting components to existing medical equipment. We used the internal connections of blood oxygen meters and webcams with simple image processing algorithms to obtain measurements. Readings were continuously sent to a server dashboard for doctors and nurses to monitor patients remotely.

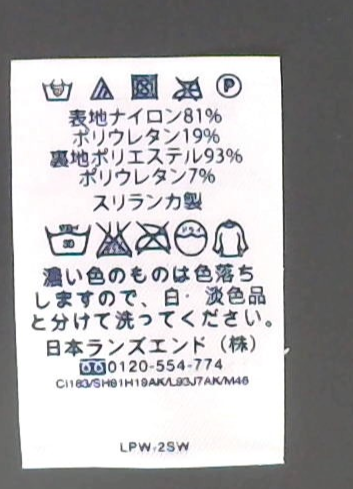
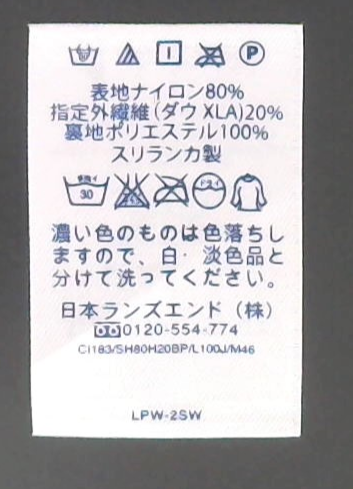
Care labels carry instructions in multiple languages across several layers. A missed stroke in Chinese can completely change the meaning of a care instruction — yet operators were manually comparing random samples against a verified master label, sometimes with a magnifying glass. Each label could take 15–20 minutes to check.
I was responsible for the project end-to-end, starting with interviews with the operators who performed the manual checks, then coordinating with managers, merchandisers, and technical staff on logistics and constraints. A firm requirement was that all data and processing had to remain local — no cloud or external servers due to compliance.
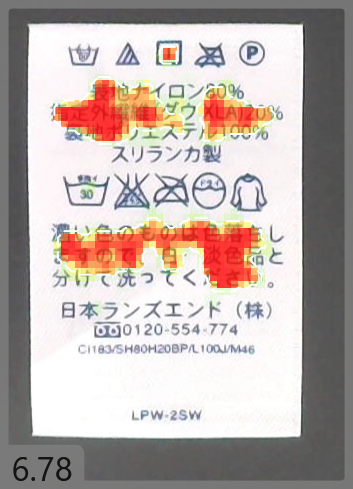
The solution used OpenCV, combining template matching and feature matching through multiple filtering layers. The system also had to be explainable — simply flagging a mismatch wasn't enough. Operators needed a visual overlay showing exactly where the discrepancy was, for use in reports and audits.
Three Iterations
Iteration 1 — Desktop Scanner: Operators placed multiple random samples on a flatbed scanner for batch comparison. A task that previously took 15 minutes per label was reduced to 1–2 minutes for an entire batch.
Iteration 2 — Industrial Camera: A camera mounted on the workspace allowed operators to position a label within the field of view and receive real-time defect overlays on screen.
Iteration 3 — Conveyor Belt: Built in close collaboration with mechanical engineering teams, this setup fed paper and card labels through the camera's field of view automatically. When the match probability fell below a threshold, the system triggered a PLC to reject the sample — no manual intervention required. This enabled checking entire batches rather than random samples, increasing operational efficiency and accuracy by up to 300%.
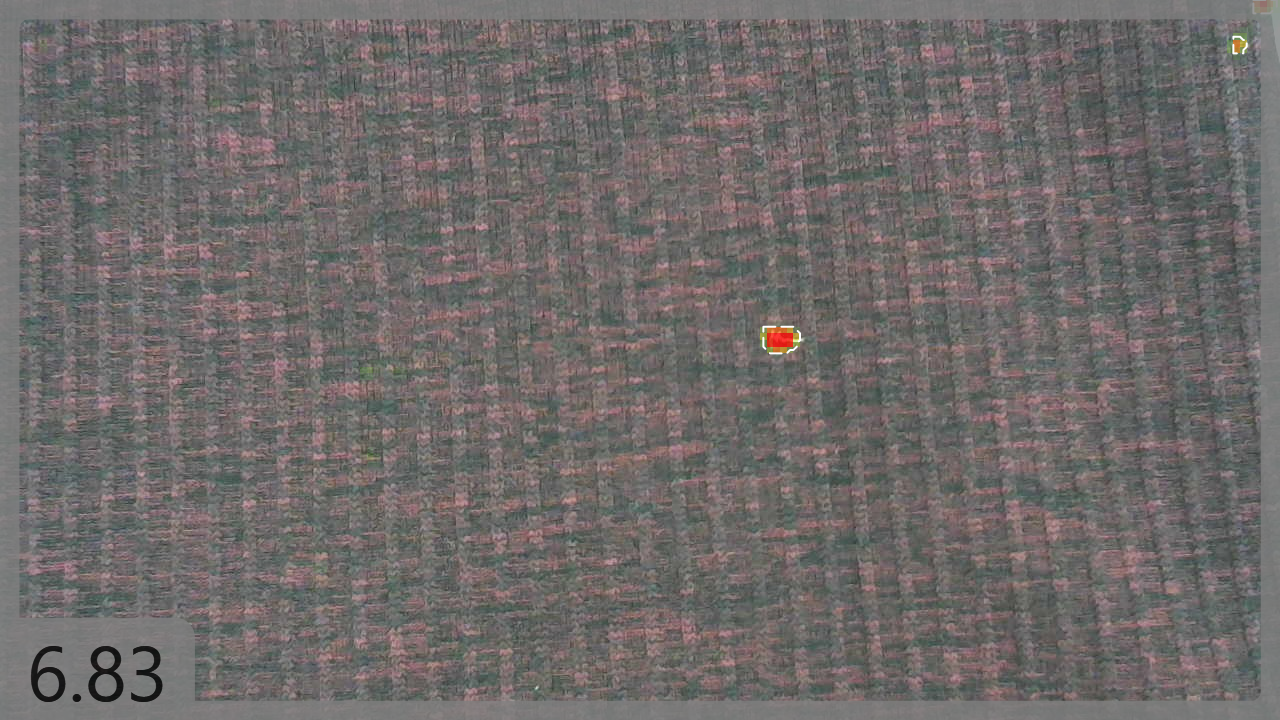
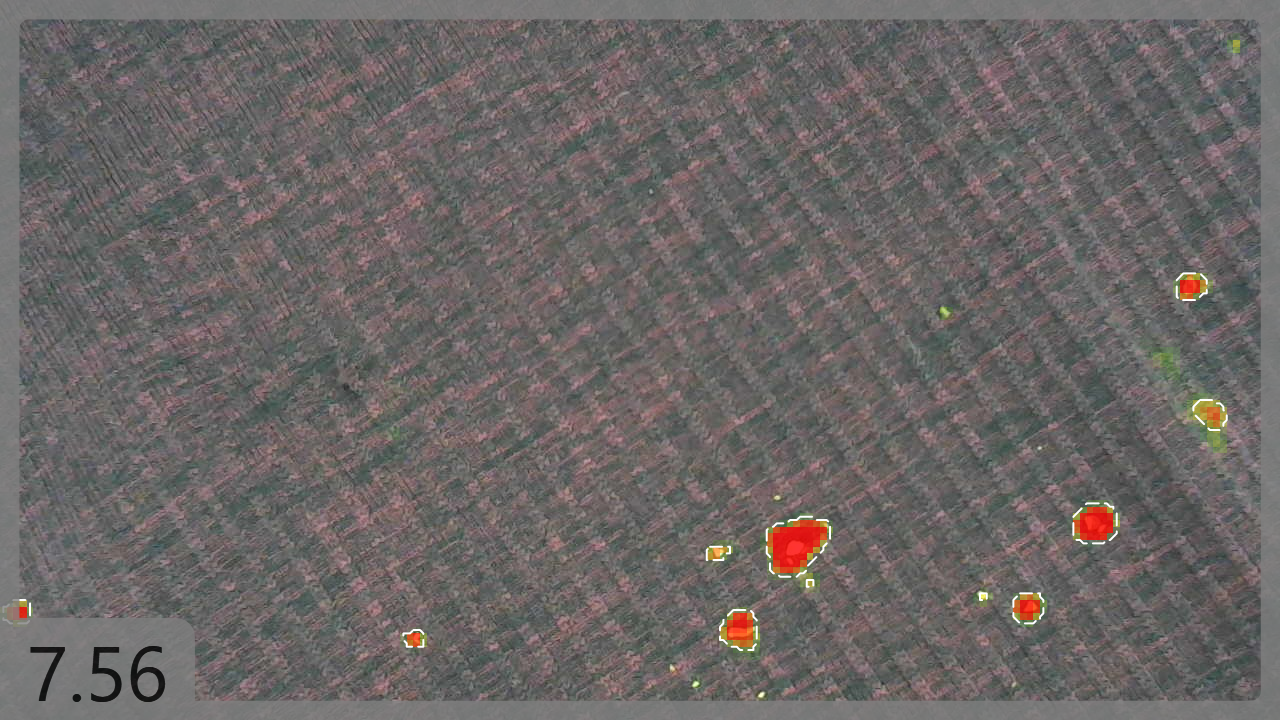
This project grew directly from my care label work. The same company operated several fabric manufacturing plants producing solid-colour rolls, and weave consistency was critical to downstream quality. Damaged or missed weaves — or foreign objects introduced during production — had to be caught early.
Unlike individual labels, random sampling wasn't viable here — every metre of every roll needed to be checked. The fabric arrived in rolls up to 60 inches wide and 100 feet long. Unwinding and rewinding solely for inspection wasn't logistically feasible. The only inspection window was at the loom itself, in real time as the fabric was being woven.
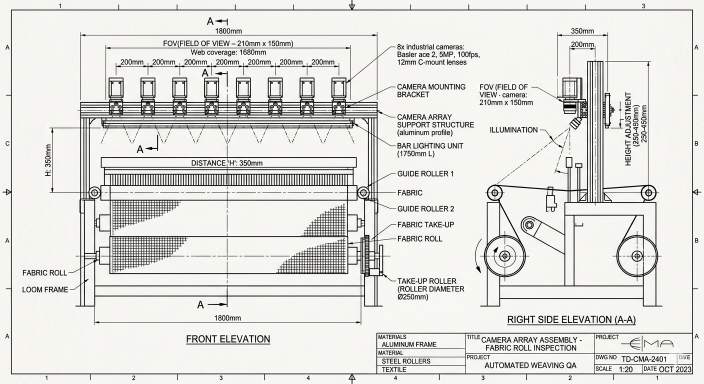
The solution used an inverted rolling-window approach: the cameras stayed fixed while the fabric moved past. An array of industrial microscopic cameras with overlapping fields of view covered the full width of the roll, mounted between the loom and the take-up roller. Computation ran near real-time — if a defect was detected, an operator had to be notified within 5–6 seconds to pause the loom and place a physical marker at the defect location. During cutting, operators would avoid marked positions.
The solution was deployed as a pilot study. Despite the significant hardware cost of the custom-framed camera array, the system reduced the operator count in the pilot loom by 50%.


Conventional garment production has a long lead time — fabric is printed, then cut, then sewn. This project flipped the model: maintain a stock of pre-made white garments and print the design directly onto the finished piece, on demand. The company had developed a mechanism to do this by loading a garment onto a flat plate with knife edges and printing via a DTG printer.
The core challenge was geometric. A design is split into two matching halves — one per side of the garment. After the first side is printed, the garment is flipped and the second half printed. But the flip is never geometrically perfect, and no garment is perfectly uniform in shape. Two halves that align in the design file rarely align on the physical garment.
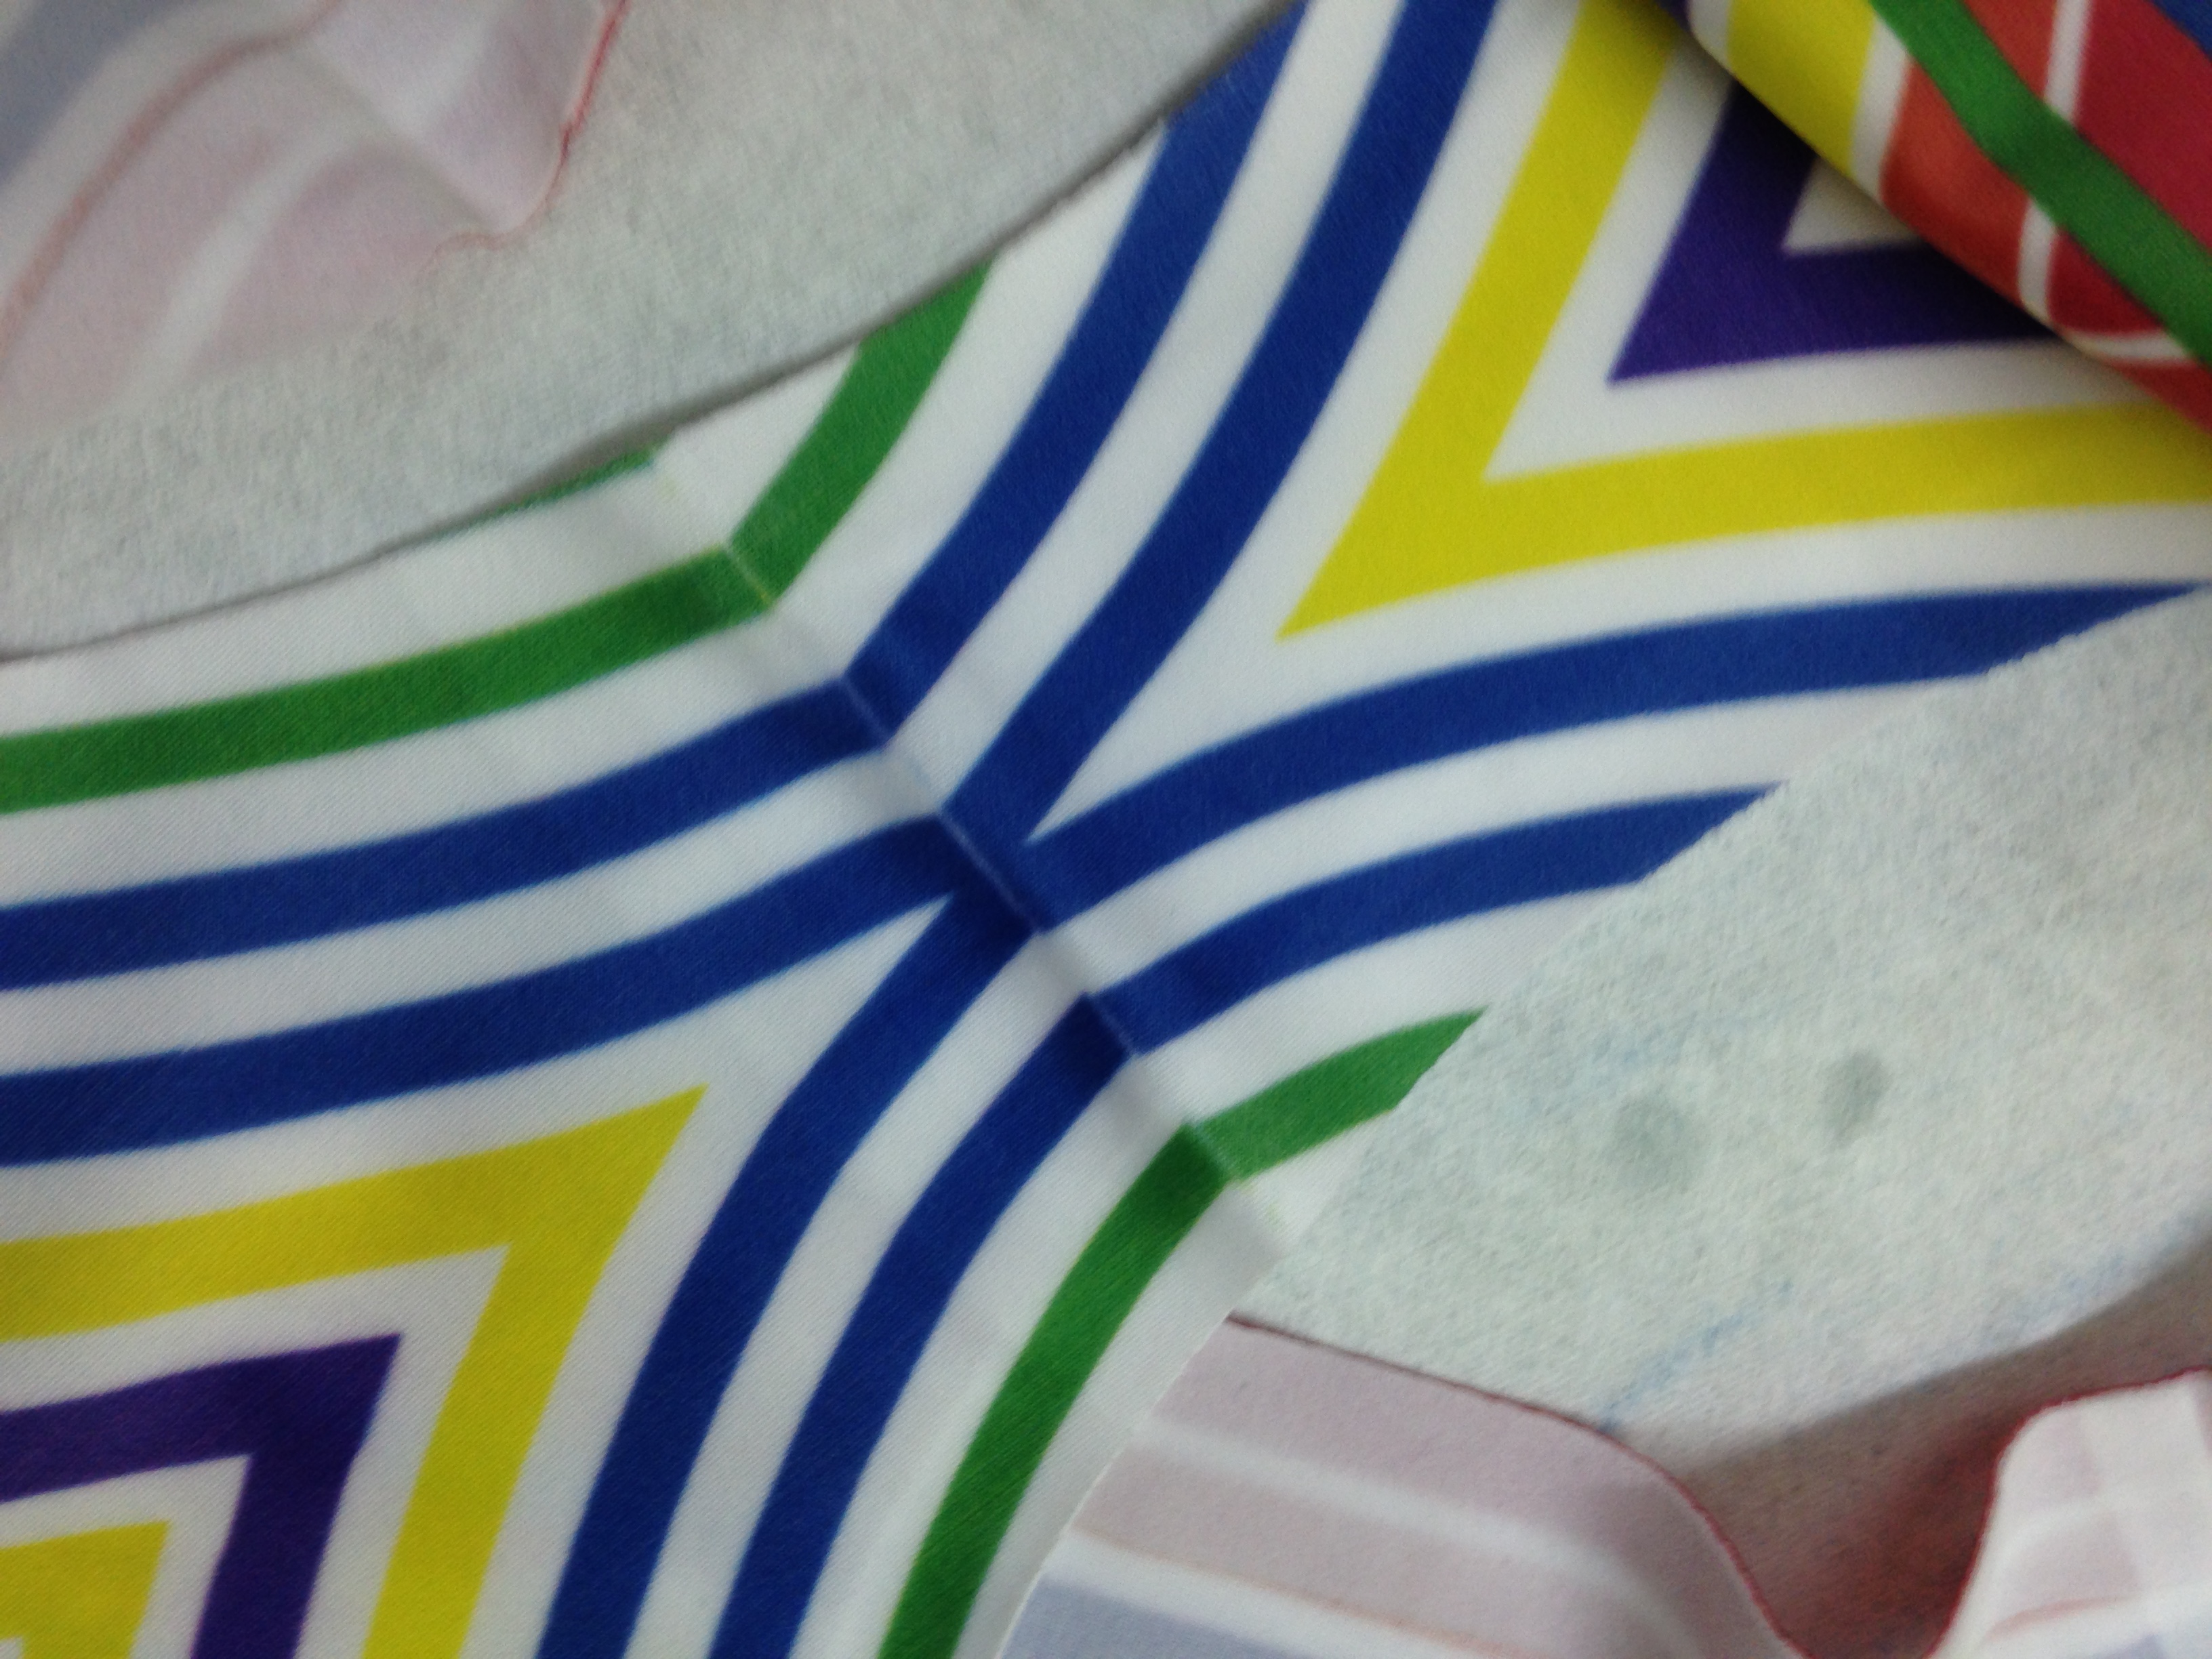
My task was to perform an intentional, calculated image distortion so that each half conforms to the actual geometry of the garment at print time. Upon loading a garment, a camera captures its geometry. The design is then warped to fit the real garment before the print command is sent — and the same process runs for the reverse side.
The details of the distortion algorithm and the custom flipping mechanism are under NDA. The resulting system completed a full two-sided print on a finished garment in approximately 4–6 minutes — a substantial reduction in lead time compared to conventional print-first production.
This leaf is yet to be inscribed.
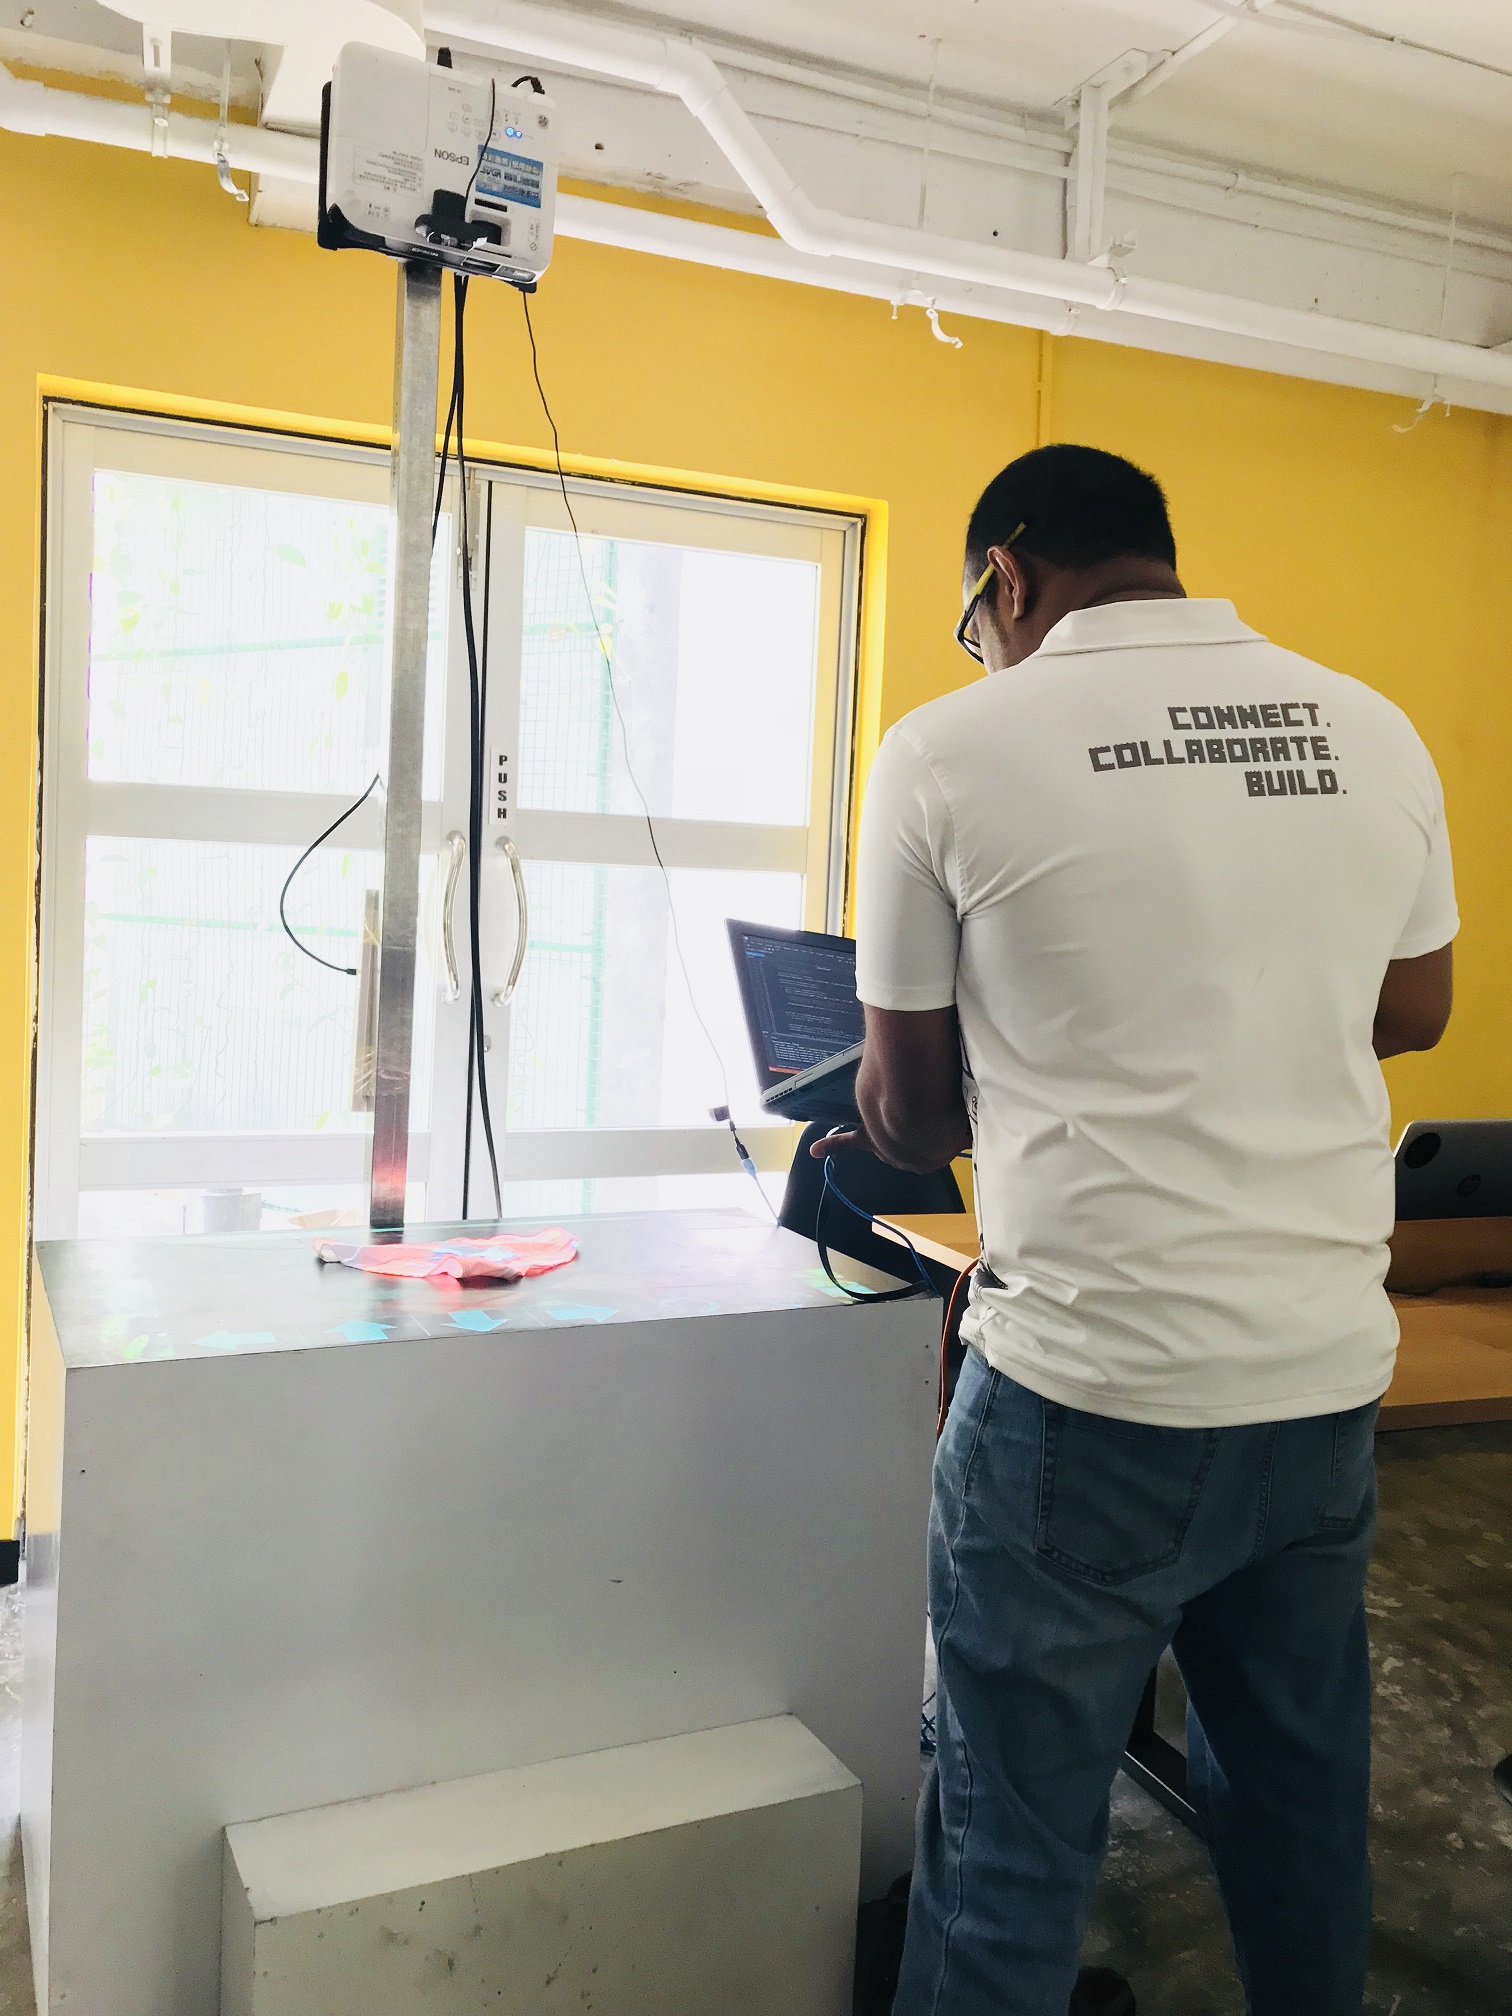
One of the coolest projects I've done was an augmented reality table to visualize prints on finished garments. A projector and camera mounted above a table captured the silhouette of garments and projected selected designs directly onto them — letting customers see how a garment would look with different prints before production.
I was the lead designer and developer. The video below shows an initial prototype; the final outcome is under NDA.
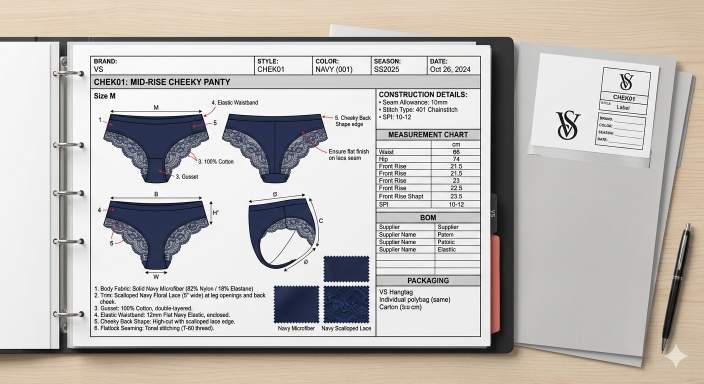
A tech pack is the comprehensive blueprint of a garment — capturing design intent, materials, measurements, and construction details for manufacturers. The company held a large archive of physical tech packs spanning years of design history, and digitizing them was essential for accessibility and long-term preservation.
This project was done before the LLM era, when OCR was still far from mature. Most tech packs followed a consistent template, which made structured extraction feasible — but it still required a pipeline combining image processing, OCR, and layout segmentation to reliably extract and map each field to the correct slot in the digital format.
I was responsible for the full pipeline — from evaluating and selecting high-resolution digital scanners, to implementing the OCR and segmentation logic, to verifying output accuracy at each stage. The result was a searchable digital archive of garment specifications, ready for integration into the company's existing product workflows.
One of the few projects I've done that sat squarely at the intersection of software engineering and hardware systems. We worked with Aeoon Kyo series Direct-to-Garment printers alongside a custom-designed loading and unloading mechanism. For the full system to work, the printer and the custom mechanism had to operate in tight synchronization.
Adding external sensors was an option, but it was intrusive — introducing new points of failure and bottlenecks. Instead, I worked directly with the Aeoon developers to understand their closed PLC system and identify trigger points that could be extracted non-invasively. In essence, reverse-engineering enough of the machine's internals to achieve integration without modifying the original hardware.
There was also a software layer: the Raster Image Processor (RIP) that drives the printer had some primitive automation hooks, which I exploited to tie the RIP workflow into the broader automation loop. The final system ran as three independent closed-loop subsystems with selected interconnects:
- Custom mechanism loads the garment onto the print plate
- RIP images the design → print starts → print finishes → bed returns to loading dock
- Custom mechanism flips the garment
- RIP images the reverse design → print starts → print finishes → bed returns
Coordination across subsystems was handled by custom C++ programs interfacing between multiple devices, with carefully placed feedback signals to ensure each system only advanced when the others were in the correct state.
The company produced laces for Noyon Dentelle, and the design process had a fascinating tradition: designers would browse physical catalogs of existing patterns, select elements from multiple designs, and combine them into new pieces. This was more efficient than designing from scratch because the weaving machines already had programs for each sub-design on file.
The problem was that this catalog existed entirely on paper — hundreds of physical lace samples, accessible only by physically browsing them. The goal was to digitize the archive and build a context-aware search system so designers could retrieve relevant sub-designs quickly.
Digitization was done using a combination of flatbed scanners and industrial microscopic cameras. Capturing lace required particular care — the 3D texture and relief of the material had to be preserved, not flattened. Each digitized entry was then tagged by a designer with rich metadata: original order number, constituent sub-designs, all orders using each sub-design, style details, flags, and searchable keywords.
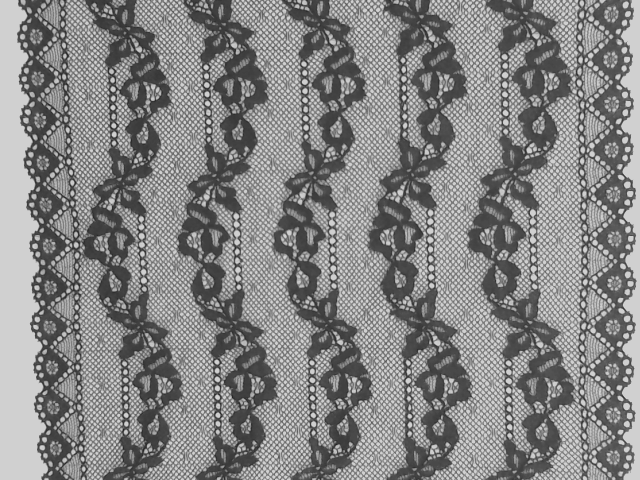

The result was a context-aware search and retrieval system integrated directly into the company's existing ERP, allowing designers to search by keyword, style attribute, or sub-design reference and instantly browse a visual catalog of relevant laces. The system is still in operation today.